Measurement of cannabinoid content, or “the potency test”, is frequently discussed in cannabis analysis. Many such methods have been developed in the past few years, but none have yet been rigorously validated and shown to work consistently with real cannabis samples of all types. Consequently, labs testing cannabis are each using different methods of analysis, and no standardized method has been universally adopted.
A recent study on Scientific Reports of the Washington state I-502 dataset has highlighted the need for lab standardization. Consistently measuring low levels of CBD in the presence of large levels of other cannabinoids is not something that all labs appear capable of. In the interests of lab standardization, we are releasing our cannabinoid analysis method into the public domain: Method Application Note – Eight Cannabinoids by HPLC-UV.
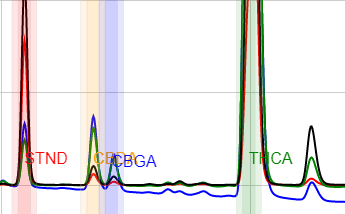
In this paper, we describe the method which has been in routine use at Confidence Analytics since 2014, measuring CBDA, CBGA, THCA, CBG, CBD, CBN, THC (delta-9), and CBC. It has acquired data on over 50,000 cannabis consumer products in that time. We include example instructions for sample preparation (including our recommended means of homogenizing flower samples), instrument selection and performance, important considerations, and an overview of our experience using this method for years.
Robustness
This method performs excellently for all cannabis flowers and concentrates. The use of a high-organic-fraction LC pump program affords useful resolution between matrix components of cannabis-infused products and the target analytes for most sample types. Adequate sample preparation removes most lipids from vial solutions. Beverages, liquid emulsions, hard candies, dairy-containing candies, gummies, baked goods, cooking oils, and salty snacks are all handled deftly by this method. Analyte retention times are essentially unaffected by various sample matrices.
Beyond The Method
As with anything in life, you only get back what you put in. Simply following the steps will not be sufficient to guarantee success. Diligence is required across all aspects of lab operations from sample intake and handling to processing, post-processing, quality assurance and more. We attribute much of our success to the care and attention our entire team takes with the samples we receive. We also pride ourselves on the customer service we deliver, regularly going beyond analysis to help our clients solve problems. This is how we expand robustness beyond our methods to our entire lab.
Moving Forward
By agreeing to a common and transparent set of standards for cannabinoid analysis in Washington state, we can work towards eliminating the differences between labs that are readily apparent to everyone in the industry. By releasing our method into the public domain, we hope to advance the standardization conversation – who will join us?
3 Comments on “Eight Cannabinoids by HPLC-UV”
Hey,
Thanks for sharing this. always good to see people working together to improve the industry as whole. I have a couple of questions:
1 – the paragraph about calibration standards and sample mass ranges, regarding maximum column load per analyte. it mentions a “table 2” that gives more details, but i could not see this table. maybe i being blind, but was it left out?
2 – On page 2 the DAD settings state a reference wavelength of 370nm with 4nm bandwidth. however the chemstation picture just below (Fig.1) shows a reference bandwidth of 80nm. can you please confirm what the reference was.
I noticed you guys also extract with methanol, then dilute with ACN:H20, unlike De becker and Swift who evaporate under nitrogen then redissolve with mobile phase. although we went and bought a tank of Nitrogen, we also decided to avoid the evaporate/dissolve step and proceed like you guys. although we still use Methanol:H20 for mobile phase, based mostly on Patel et al (2017). nice to see we were not the only ones to avoid the evaporate step.
Thank you for taking the time to read it, Tan! This is exactly the kind of engagement we seek – other cannabis scientists discussing the finer points of their work. We have amended the document per the two things you found. We were worried that nobody would read the Discussion sections!
1. Table 2 was supposed to be a rudimentary calibration curve, but this was left out. The one mention of Table 2 was removed.
2. Good eye on the DAD settings! I forgot to mention that the slit width is set to 4 nm, and you are correct that the reference bandwidth is 80 nm. Something we could do with this method is acquire a non-inject run as a subtraction background, thus eliminating the need for a reference wavelength. Luckily, our baseline slope on 220 nm is deftly handled by ChemStation’s automatic integration!
Thank you for noticing how this prep is simplified, and for specifying you treat it similarly! Evaporation to dryness, a concentration step, is purely superfluous when we need to *dilute* the sample to fit it within the dynamic range of the standards. Methanol and acetonitrile both play well together, and cannabinoids are soluble at low levels in 50:50 water:acetonitrile.
Good Morning
How are you? Could you give me the wavelengths of cannabinoid in this paper, please