The chart below depicts the THC Total values for all flower samples submitted to Confidence Analytics and reported to the WSLCB’s seed-to-sale traceability system to date. As you can see, it’s pretty steady at 18% average, but there’s always a slight dip in the late fall season. Typically, the central 50% of the distribution is between 15 and 20%.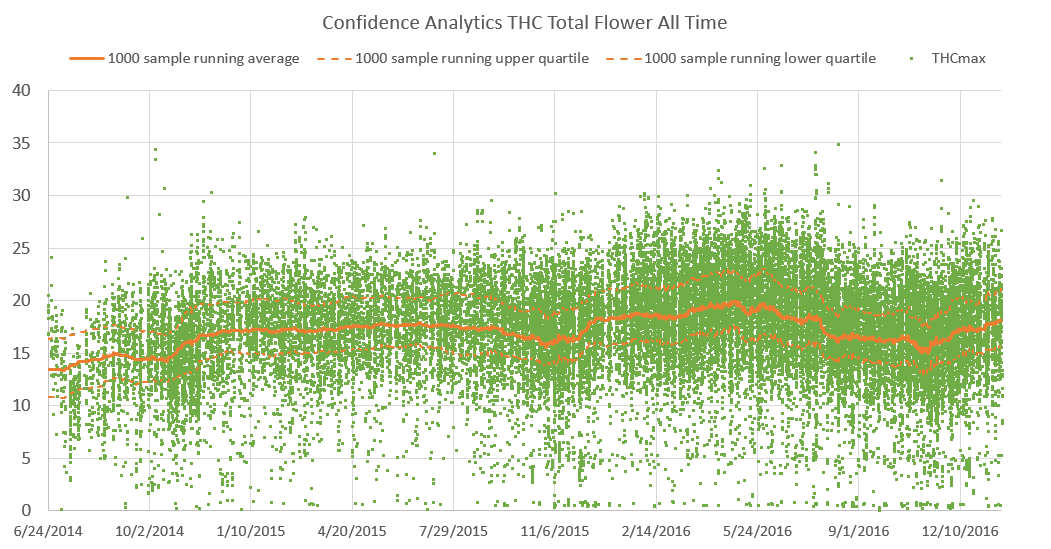
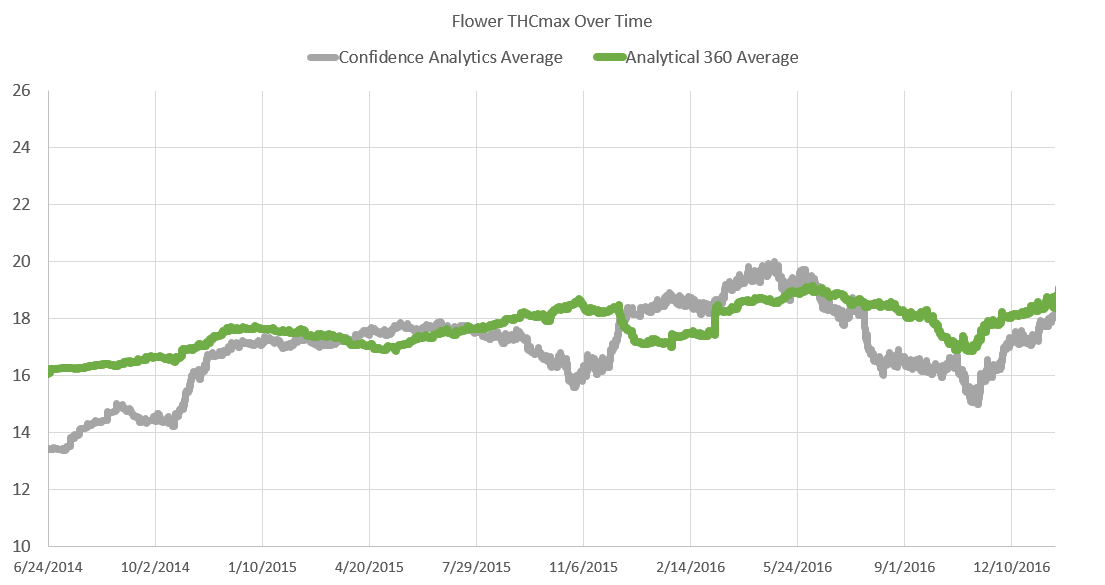
When comparing Confidence Analytics to the next leading laboratory, Analytical 360, we find some of the same trends emerging. The graph below depicts average THCmax for both labs over time (THCmax = THC + THCA*0.877). Averaging about 18% and trending slightly upward over time, both labs appear to be observing a similar population of Cannabis flower.